Thursday, December 2, 2021

Colonial Settlement Brochure Project

Early colonial settlement in British North American began in regions, such as New England and the Chesapeake. These regions are great examples to compare because it opens the opportunity to analyze how geography shapes how people live.


Enduring Understanding: Where we live impacts how we live.

Since this understanding is so crucial if we are to be able to situate why specific economic and cultural developments impact social and government structures, a meaningful experience like making a promotional brochure is a reasonable option.

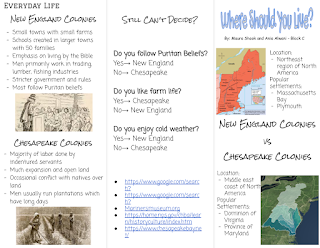
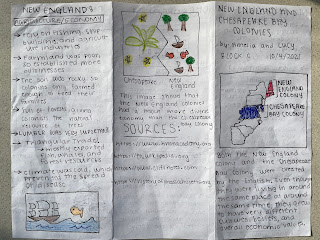
Students were tasked with making trifold brochures, either paper or digital, to provide information to potential settlers. I told them that the audience knew they needed to move to the New World but didn't know which region would best suit their needs.

Some students chose to use the Google slides template (see below), while others decided to use paper and make it by hand. Even though our world is more and more digital everyday, I don't believe it's necessary to expect everyone to appreciate digital media.

Those students who chose to make the brochure by hand were still expected to turn in the project via Google Classroom. This meant their paper-base work was still made digital for sharing and future access. 

The final product discussion included a general presentation about the information they chose to include and what they learned about making the brochures. I usually take this opportunity to talk about what makes a good oral presentation and try to get students to be more themselves and share what they like about the project or content.

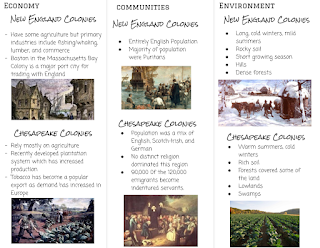
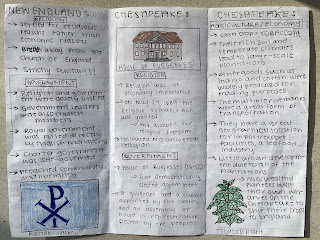
By making the brochure, students explored the cultural, economic, and political similarities and differences between these regions. As we made progress through the unit, it was easier for them to differentiate the character of each region and how much diversity the British colonies fostered, and, in some case, forbade. 

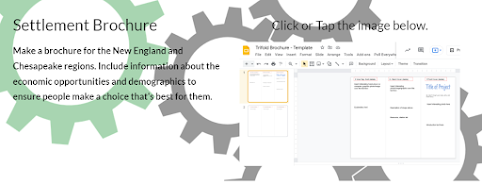
Google Slides Template for Brochure Project

 Click or tap the image for a link to the brochure template. It's a copy link, so click the blue button 


Brochure Project Exemplars


Monday, October 22, 2018

Scramble for Africa - Making Timelines With The Knight Lab Tool

Making good digital products is so important for kids to learn. That's why I have my students do at least half or more of their timeline and map making through digital means. We've tried different timeline apps and even made them more organically with Google apps, but none of those options turned out great results.

Knight Lab by Northwestern University provides several templates for making a variety of presentation formats that pull information from Google Sheets. The lab has easy-to-follow directions and a simple process to take a Google Sheet URL and make a front end for it to embed in your website. Sites like Time magazine and the U.S. Department of Energy have been known to use the Knight Lab tools.

Here's our process for making the following Scramble for Africa timeline. It's not perfect, but there was a lot discuss and learn from this activity and final product.

The Template

The template can be found on the knight lab website. Click the button that says "Get the Spreadsheet Template." Make a copy of the template, add it to your drive, and share it with your students.


Students can complete the template, but make sure they are careful about following directions. The timeline won't come out the other end properly if there are small mistakes in the spreadsheet. If you run into trouble or don't what to write in a cell, hover over the column headings to reveal the directions.


Publish the spreadsheet to the web and grab the link to paste into the Knight Lab "machine." Follow the directions carefully on this one because it's already changed from one year to the next. The directions worked as they promised, however.


Grab the link to the timeline or copy the embed code to paste it into your html editor. And that's it. You may have to fine tune the information on the Google sheet, but that's all.

Here's our class's finished timeline. 

Wednesday, December 13, 2017

Soviet Union Personal Project Highlights

This unit on the Russian Revolution was a great opportunity for me to let go a little and see what my students can do. The assignment was a personal project on anything related to their interest and life in the Soviet Union.

The form below is a copy of what I had students submit. This allowed them to think about their interests in a step-by-step process, which teaches them what it takes to find a topic for term papers, for example.

I was excited with the results because everything I was going to teach in the same old way was addressed through the plurality of the student presentations (see highlights below).

They are not perfect, of course, but it only took a class period (77 minutes) for individuals to work on the presentations and two class periods to present -- time well spent.

Students received grades and actionable feedback via Google Classroom, and I used this highlights slide show (below) to debrief the whole project.


Wednesday, April 12, 2017

Dialogues From The Trenches

The changing view of war in the modern era of world history was a consequence of new technology, among other things. The letters written from the trenches of WWI were mailed home on a regular basis. With trains and mail service in full swing, the horrors of war and the deterioration of soldiers was apparent to loved ones waiting at home.

The impact of technology on changing views of societies is crucial if students are to empathize with major people events in history. This sort of empathy building also supports critical analysis of new technologies and how to predict the consequences, a skill that has never before been so dire than in the mobile age of the Internet.

The following activity was made with Docs Story Builder and the a WWI exhibit by the Library of Congress. Here are some of the student work samples, preceded by my introduction.

Click or Touch Images

 Click Image

 Click Image

 Click Image

 Click Image


Friday, January 27, 2017

Infographics: Civil War Tech

The Civil War is often referred to as the first modern war. My ninth graders studied new technology during the period to learn what was so modern about the war.

Every student was assigned one of six Civil War technologies. They researched the developments and made an infographic to present their findings. Most students used Google Drawing, while a handful used Piktochart or Canva.

The GIFF below shows the Google Form we used to vote for the infographics used in this post. 


Minnie Ball


Railroads

Telegraph


Photography

Battlefield Medicine


Embalming


Friday, December 30, 2016

Maps and Timelines From Early America to the Revolution

With all of the map-making tools available, learners can present information through maps with a few selections, drags, and drops. It sounds exciting, right? I think so, too, but I'm not sure that's exactly what my high school social studies classes need.


Before designing an activity, I ask myself how much of the work will be done by the students and how much will be done by the teacher. This same question is useful for choosing tools to make and publish student work. I want my students to learn basics about computing and problem solving, so tools that do a lot of that for them are too "paint-by-number" for our class.

My choice for most activities is usually from the Google Apps Suite. For maps, we often use Slides because it acts like a blank canvas. A page setup can be changed to accommodate any printing or publishing needs, and my students learn technology skills that transfer to many applications. Drawing and My Maps are great choices, too.

Here's a couple of examples of map-making activities with Slides. Click on the images and linked text to explore the maps.

Columbian Exchange


Jamestown Timeline


Road to Revolution (click or touch image)


This is a PDF with links to Wikipedia made using Slides. Students were given ideas about what they could do to make this more than a digital version of a print activity. Some students did more by adding links. One of the practice assignments that put this timeline into action was a video tutorial. I did not include those student work examples in this post because students were not ready at the time of publishing, which was mostly my fault.  

What's Next?

Along with using these maps and timelines for video tutorials, we can also consider publishing something with a cleaner look for a website. If you are not familiar with Knight Lab at Northwestern University, check out the lab's StoryMap.

The Knight Lab site includes several tools that use Google Sheets to publish clean looking slide presentations and timelines, to name a couple, that are high enough quality for a respectable website. All of the timelines on the Gilder Lehrman site use Knight Lab tools.

At the end of the day, I don't want my students to experience the Crayola curriculum equivalent to 1:1 instruction. At the Digital History Farm, students will explore tools that require them to learn concepts they will see on many of the applications and websites used by businesses and institutions necessary for a successful society. 

Monday, December 26, 2016

Causes of the Civil War Inquiry and Collaboration

One of the most important routines that secondary students need to master is understanding the question. I often read essays that do not answer all parts of the question (or prompt) or do not provide analysis that the question requires.


The following student work came from a study on the causes of the Civil War. It started with three given questions to which students asked questions they needed answered to find the information required to respond to the given question. The students' questions were shared via Poll Everywhere for class discussion.

This activity got them ready to research several issues related to the causes of the Civil War (collaborative notes link below). After the research activity, we discussed the stronger points and moved on to a longer reading selection, "Why the War Came," which is about the 1850's and how a lot of the issues were pushing the country toward war.

Questions About Questions (Poll Everywhere)


Collaborative Notes - Published Google Doc

I love Google Docs because it is simple yet satisfies many of the needs of a 21st Century connected classroom. Although a lot of businesses and project teams use complex programs to collaborate and publish, Google Docs can do a lot of the same heavy lifting. At the very least, Google Docs provides my students the practice they need to solve technology issues in a collaborative setting.

What's Next?

Final products for this activity could include making maps or timelines, as well as slide presentations or videos. I had a mapping the causes activity that I might want to do in the future so we can summarize and publish the notes.

We might try Google My Maps, Slides, or one of the tools by Northwestern University's KnightLab (timeline, story map).